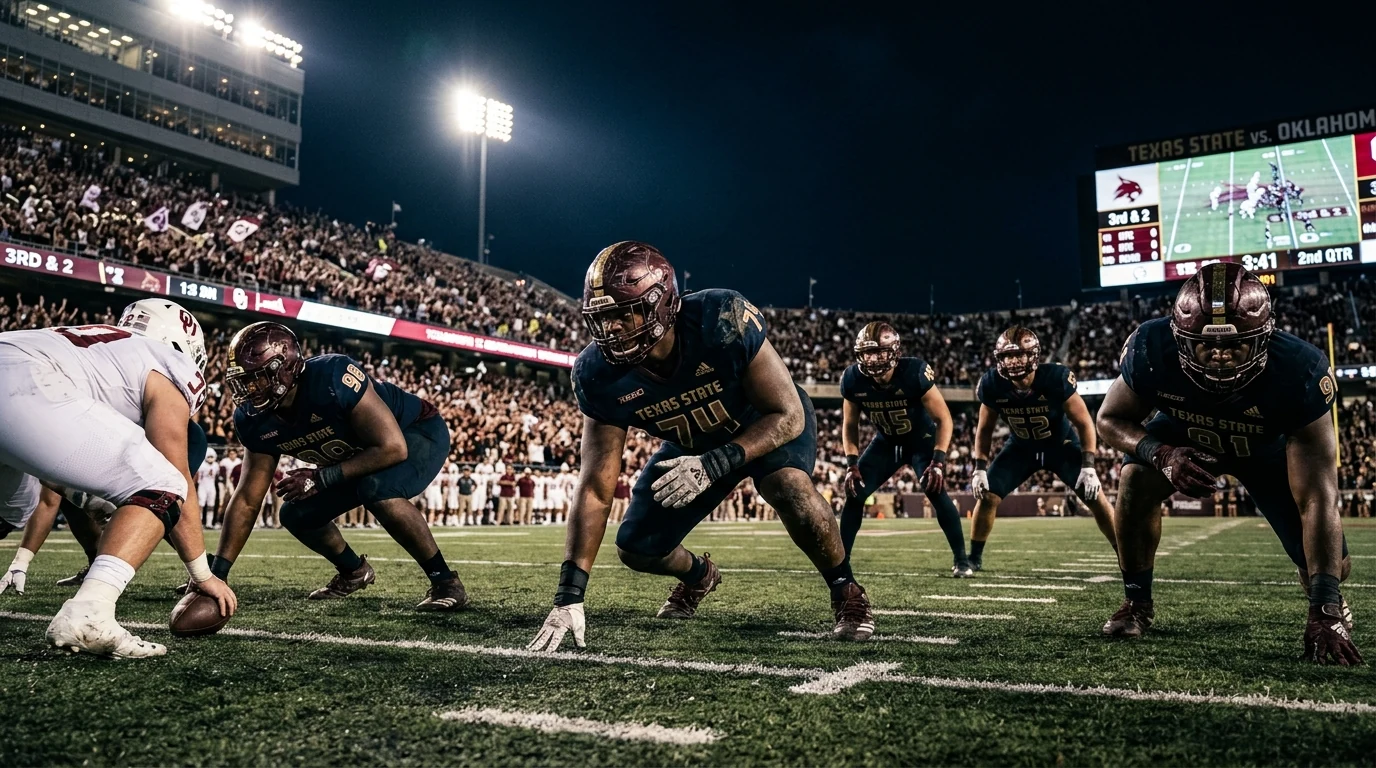
Defensive coordinators in NCAA football face constant tactical challenges due to the wide adoption of high-tempo spread offenses. To counter perimeter speed and downfield passing, defensive units have adapted their base alignments, moving away from heavy traditional 4-3 packages toward hybrid nickel and dime coverages.
CFBBite CFB Performance Metrics and Defensive Data
Statistical evaluation on CFBBite includes defensive efficiency metrics such as opponent yards per play, success rate per down, and turnover margin. Tracking these metrics offers objective criteria to compare defensive units across different FBS athletic conferences.
Pass Coverage Efficiency and Secondary Alignment Metrics
Modern secondaries rely heavily on split-field safety safety coverages, allowing defensive backs to change assignments post-snap. Cover-4 quarters and Cover-3 match zone schemes remain effective countermeasures against perimeter pass options.
Front Seven Line Pressure Rates and Rushing Defense Ratings
Defensive lines must generate interior pressure without blitzing linebacker help to maintain coverage integrity. Defensive tackle disruption in the A-gaps remains a critical indicator of run-stopping stability.
Special Teams Impact on Average Field Position Outcomes
Punting distance, touchback percentages, and coverage team speed directly determine opponent starting field position, heavily influencing defensive success across four quarters.
Statistical Analysis of Red Zone Defensive Stop Percentages
Restricting opponents to field goals inside the 20-yard line serves as a key measure of defensive resilience, often deciding close conference contests.